csv파일을 Import 하는 방법은 아래 포스팅에 자세히 적혀있습니다.
[PostgreSQL] CSV File를 Table에 삽입(Import)하기.
CSV파일을 PostgreSQL에 삽입하는 방법은 다음과 같습니다. 먼저 데이터를 다운로드합니다. 그리고 데이터를 넣을 데이블을 만들어줍니다. DROP TABLE IF EXISTS sale_data; CREATE TABLE sale_data ( order_id S..
ysyblog.tistory.com
Data소개
1. 고객로그데이터
2010년 12월부터 2011년 2월초까지 어느 온라인쇼핑몰의 고객 주문 로그 데이터입니다. 아래 데이터를 database에 import합니다.

테이블을 만들기 위한 SQL 쿼리입니다.
DROP TABLE IF EXISTS online_sales;
CREATE TABLE online_sales (
  order_id SERIAL,
  invoice integer,
  stockcode VARCHAR(255),
  description VARCHAR(255),
  quantity integer,
  date DATE,
  price float(50),
  customerid VARCHAR(50),
  country VARCHAR(50),
  Primary KEY(order_id)
);
2. 사용자데이터
고객들의 성별, 나이, 등록일, 등록기기 등의 정보를 모아둔 데이터입니다. 고객로그데이터의 customer_id를 기반으로 임의로 만든 데이터입니다.(랜덤추출)
테이블을 만들기 위한 SQL 쿼리입니다.
DROP TABLE IF EXISTS customer_info;
CREATE TABLE customer_info (
  order_id SERIAL,
  customerid VARCHAR(50),
  age integer,
  register_date DATE,
  register_device VARCHAR(50),
  sex VARCHAR(50),
  Primary KEY(order_id)
);

select *
from customer_info;
국가별 사용자 수 집계
국가별로 얼마나 주문을 하는지, 1인당 주문을 얼마나 하는지 알아보는 쿼리입니다.
with문을 활용하여 총 주문을 임시로 구하고, 기존 테이블과 CROSS JOIN하여 점유율과 주문률을 구하였습니다.
with stats as(
	select count(distinct customerid) as total_co
	from online_sales
)
select
	l.country -- 주문한 국가
	,count(distinct l.customerid) as action_co -- 주문고객 수
	,count(1) as action_count -- 총 주문 수
	,s.total_co -- 전체 주문자수
	,round(100.0 * count(distinct l.customerid) / s.total_co,2) as usage_rate -- 국가별 점유율
	,round(1.0 * count(1) / count(distinct l.customerid),2) as count_per_user -- 국가별 1인당 주문률
from online_sales as l
	cross join
	stats as s
group by l.country, s.total_co;

- 총 주문 빈도는 영국이 가장 높고 인당 주문률은 아일랜드(EIRE)가 가장 높았습니다. 해당 온라인 쇼핑몰은 영국 사이트라고 유추해볼 수 있습니다.
사용자 연령 집계
나이 구간을 기준으로 사용자의 그룹을 나누었습니다. 20살 미만은 Teen(청소년층), 20~39살은 Youth(청년층), 40~59살은 Ender(장년층), 그 이후 나이는 Old(노년층)으로 지정하고 성별과 합쳐서, 사용자들을 구분하였습니다.
with user_age as(
	select customerid
		,sex
		,age
		,concat(sex,
			   Case
			   	when age < 20 Then '_Teen'
			   	when age between 20 and 39 Then '_Youth'
			    when age between 40 and 60 Then '_Elder'
				Else '_Old'
				End)
			as age_split

		from customer_info
)
select *
from user_age;

연령그룹별 카테고리 집계하기
- 각 연령그룹별로 카테고리마다 얼마나 구매했는지를 보여주는 쿼리입니다.
with user_age as(
	select customerid
		,sex
		,age
		,concat(sex,
			   Case
			   	when age < 20 Then '_Teen'
			   	when age between 20 and 39 Then '_Youth'
			    when age between 40 and 60 Then '_Elder'
				Else '_Old'
				End)
			as age_split

		from customer_info
)
select
	o.category
	,u.age_split
	,count(*) as purchase_count
from
	online_sales as o
	join
	user_age as u
	on
	o.customerid = u.customerid
group by o.category, u.age_split;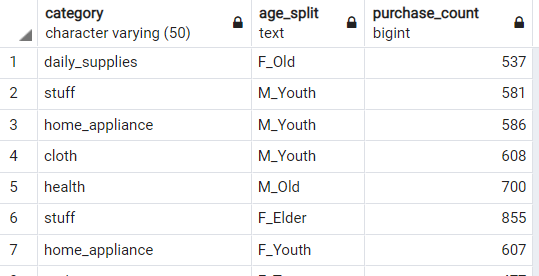
사용자의 방문빈도 집계
- 사용자가 해당사이트에서 얼마나 자주 구매했는지 알려주는 쿼리입니다.이
with user_count as(
	select
		customerid
		,count(distinct date) as action_day_count
	from online_sales
	-- 12월 첫째주 대상을 방문횟수 체크
	where date between '2010-12-01' and '2010-12-07'
	group by customerid
)
select
	action_day_count
	,count(distinct customerid) as user_count
from user_count
group by action_day_count
order by action_day_count;
- 위 표를 해석하면, 1주일 동안 한 번 방문한 사람은 387명, 2번 방문한 사람은 32명, 3번 방문한 사람은 2명이다.
여러 카테고리를 구매한 사용자 수 집계(CUBE)
- 어떤 사람은 하나의 카테고리만 구매하는 반면, 다른사람은 여러 카테고리를 구매할 것입니다. 따라서 여러 카테고리를 사는 사람이 얼마나 되는지 알아보겠습니다.
- 카테고리 숫자가 많으므로, cloth/health/cook 세 카테고리만 분석하겠습니다.
- 해당 분석결과로 벤다이어그램을 만들거나, 장바구니분석(연관성분석)에 활용 할 수 있습니다.
- CUBE 구문을 통해 모든 조합에 대해 사용자 수를 집계할 수 있습니다.
-- 사용자마다 세 카테고리를 주문했는지 집계
with user_category as(
	select
		customerid
		,SIGN(sum(case when category='cloth' then 1 else 0 end)) as buy_cloth
		,SIGN(sum(case when category='health' then 1 else 0 end)) as buy_health
		,SIGN(sum(case when category='cook' then 1 else 0 end)) as buy_cook
	from online_sales
	group by customerid
)
, user_group as(
	select buy_cloth, buy_health, buy_cook, count(1) as users
	from user_category
	group by CUBE(buy_cloth, buy_health, buy_cook)
)
select *
from user_group
order by buy_cloth, buy_health, buy_cook;
이를 벤다이어그램으로 만들기 좋게 만들려면 다음과 같이 쿼리를 진행한다.
-- 사용자마다 세 카테고리를 주문했는지 집계
with user_category as(
	select
		customerid
		,SIGN(sum(case when category='cloth' then 1 else 0 end)) as buy_cloth
		,SIGN(sum(case when category='health' then 1 else 0 end)) as buy_health
		,SIGN(sum(case when category='cook' then 1 else 0 end)) as buy_cook
	from online_sales
	group by customerid
)
, user_group as(
	select buy_cloth, buy_health, buy_cook, count(1) as users
	from user_category
	group by CUBE(buy_cloth, buy_health, buy_cook)
)
select
	case buy_cloth
		when 1 then 'cloth' when 0 then 'not purchase' else 'any'
	end as buy_cloths
	,case buy_health
		when 1 then 'health' when 0 then 'not purchase' else 'any'
	end as buy_healths
	,case buy_cook
		when 1 then 'cook' when 0 then 'not purchase' else 'any'
	end as buy_cooks
	,users
	,round(100.0 * users / NULLIF(
			SUM(Case when buy_cloth is null
			   	and buy_health is null
			    and buy_cook is null
			   then users else 0 end) over()
		,0),2) as ratio
from user_group
order by buy_cloths, buy_healths, buy_cooks;
해당 포스팅은 다음의 책을 활용하여 작성하였습니다.
'SQL & DB > PostgreSQL' 카테고리의 다른 글
| [PostgreSQL] 사용자 로그데이터(Log Data) 매출분석(3) - RFM 분석 (0) | 2021.01.15 |
|---|---|
| [PostgreSQL] 사용자 로그데이터(Log Data) 매출분석(2) - DECILE분석 (사용자 그룹화 하기) (0) | 2021.01.15 |
| [PostgreSQL] 카테고리별 매출 파악(ABC분석, 매출변화율, 도수분포표(히스토그램)) (0) | 2021.01.11 |
| [PostgreSQL] 매출데이터 시계열 분석하기(이동평균분석, 월별, Z차트분석) (0) | 2021.01.11 |
| [PostgreSQL] CTE (WITH 절) (0) | 2021.01.08 |