이번포스팅은 로그데이터를 시계열로 분석하는 포스팅입니다.
로그데이터 매출 분석은 아래 포스팅들을 참고해주세요
1. 사용자 로그데이터(Log Data) 매출분석(1) - 사용자들의 특징 찾기 : ysyblog.tistory.com/146?category=1176025
2. 사용자 로그데이터(Log Data) 매출분석(2) - DECILE분석 : ysyblog.tistory.com/147?category=1176025
3. 사용자 로그데이터(Log Data) 매출분석(3) - RFM 분석 : ysyblog.tistory.com/148?category=1176025
데이터 소개 및 Import
먼저 데이터를 데이터베이스에 Import합니다.
사용자데이터와 로그데이터는 이전에 썻던 데이터와 유사하지만, 효과적인 분석을 위해 사용자데이터의 등록기간은 줄이고, 로그데이터는 시계열분석을 위해 기간은 늘리고 소비자의 액션 칼럼을 추가하였습니다.
로그데이터는 어떤 온라인 쇼핑몰의 2010년 12월부터 2011년 6월 중순까지의 데이터입니다. Action칼럼에서 View는 물건을 단순히 본것이고, basket는 물건을 장바구니에 담은 것이며, buy는 물품구매가 이루어진 것입니다. unitprice는 모든 경우에 표시되지만 quantity는 구매시에만 표시됩니다.
데이터를 데이터베이스에 import하는 방법은 아래 링크를 참고하세요.
ysyblog.tistory.com/143?category=1176025
[PostgreSQL] CSV File를 Table에 삽입(Import)하기.
CSV파일을 PostgreSQL에 삽입하는 방법은 다음과 같습니다. 먼저 데이터를 다운로드합니다. 그리고 데이터를 넣을 데이블을 만들어줍니다. DROP TABLE IF EXISTS sale_data; CREATE TABLE sale_data ( order_id S..
ysyblog.tistory.com
수정된 로그데이터와 SQL쿼리입니다.
DROP TABLE IF EXISTS sales_date;
CREATE TABLE sales_date (
  order_id SERIAL,
  customerid VARCHAR(50),
  date date,
  quantity integer,
  price float(50),
  action VARCHAR(50),
  Primary KEY(order_id)
);
수정된 사용자정보(customer_info) 데이터입니다. SQL쿼리는 이전과 같습니다.
DROP TABLE IF EXISTS customer_info;
CREATE TABLE customer_info (
  order_id SERIAL,
  customerid VARCHAR(50),
  age integer,
  register_date DATE,
  register_device VARCHAR(50),
  sex VARCHAR(50),
  Primary KEY(order_id)
);
등록 추이 분석
먼저 Customer_info(사용자 정보)를 시계열 분석하겠습니다. 해당 데이터에는 해당사용자가 언제 등록했는지를 보여주는 데이터입니다. 이를 활용해서 사용자가 날짜별로 등록을 얼마나했는지 분석하겠습니다.
-- 날짜별 등록 추이
select register_date
	,count(distinct customerid) as register_count
from
	customer_info
group by register_date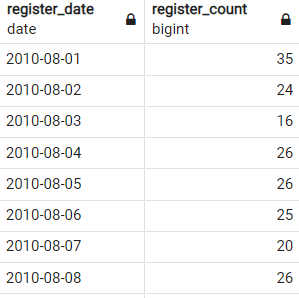
이번에는 월별 등록수와 전월대비 변화율을 집계하겠습니다.
year_month로 groupby 집계를 할것인데, 중요한 것은 year_month를 substring을 활용하여 추출할때, 형변환을 해주어야한다는 것입니다.(date -> text) substring는 date에서 작동하지 않기 때문입니다.
-- 월별 등록추이 및 월별 변화율
with
user_year_month as (
	select *
		,substring(register_date::text,1,7) as year_month
	from customer_info
)
select year_month
	,count(distinct customerid) as register_count
	,lag(count(distinct customerid)) over(order by year_month) as last_month_count -- 지난달 횟수
	,round(1.0 * count(distinct customerid) / lag(count(distinct customerid)) over(order by year_month),2) as month_over_month_ratio --전월대비 변화율
from user_year_month
group by year_month;
단순 등록한 횟수를 집계할 뿐만 아니라 다른 것에 기준해서 집계할 수도 있는데, 여기서는 등록디바이스에 따른 사용자 등록수를 집계하겠습니다.
-- 월별 디바이스에 따른 사용자 등록수
with
user_year_month as (
	select *
		,substring(register_date::text,1,7) as year_month
	from customer_info
)
select year_month,
	count(distinct customerid) as register_count
	,count(distinct case when register_device = 'pc' then customerid end) as register_pc
	,count(distinct case when register_device = 'sp' then customerid end) as register_sp
	,count(distinct case when register_device = 'app' then customerid end) as register_app
from user_year_month
group by year_month;
지속률과 정착률
사용자가 아무리 많아도 사이트를 활용하지 않는다면 의미가 없을 것입니다. 사용자가 등록하고 사이트를 얼마나 사용했는지 파악할 수 있는 지표가 지속률과 정착률입니다.
- 지속률 : 등록일 기준으로 이후 저정일 동안 사용자가 서비스를 얼마나 이용했는지 나타내는 지표
- 정착률 : 등록일 기준으로 지정한 7일동안 사용자가 서비스를 사용했는지 나타내는 지표
참고할 것은 customer_info자체가 임의로 만든데이터이기 때문에 결과가 조금 이상하게 나올 수 있습니다.
지속률
먼저 등록 후 다음날까지의 날짜별 지속률을 파악해보겠습니다.
이때 다음날 액션을 했는지 판단하는 쿼리를 만들어야합니다. 쿼리 구성 원리는, 지표 대상기간에 액선을 했는지 나타내고(SIGN) 사용자 별로 대상 기간에 한 액션 합계 구한후(SUM), 등록 다음날이 로그의 최신날짜 이전인지 확인하고(첫번째 CASE), 지표의 대상기간이 액션을 했으면 1, 안했으면 0이라고 지정합니다.(두번째 CASE)
with sales_users as(
	select c.customerid
		,c.register_date
		,s.date as action_date
		,max(s.date) over() as latest_date
		-- 등록일 다음날의 날짜
		,cast(c.register_date + '1 day'::interval as date) as next_day
	from customer_info as c
		left outer join
		sales_date as s
		on c.customerid= s.customerid
)
, user_flag as(
	select
		customerid
		,register_date
		,sign(sum(CASE WHEN next_day <= latest_date THEN
				 	case when next_day = action_date then 1 else 0 end
				   END)) as next_day_action
	from sales_users
	group by customerid ,register_date
)
select *
from user_flag
order by next_day_action desc;
-- 등록 후 다음날까지의 지속률
with sales_users as(
	select c.customerid
		,c.register_date
		,s.date as action_date
		,max(s.date) over() as latest_date
		-- 등록일 다음날의 날짜
		,cast(c.register_date + '1 day'::interval as date) as next_day
	from customer_info as c
		left outer join
		sales_date as s
		on c.customerid= s.customerid
)
, user_flag as(
	select
		customerid
		,register_date
		,sign(sum(CASE WHEN next_day <= latest_date THEN
				 	case when next_day = action_date then 1 else 0 end
				   END)) as next_day_action
	from sales_users
	group by customerid ,register_date
)
select register_date
	,avg(100.0 * next_day_action) as repeat_rate_day
from user_flag
group by register_date
order by register_date;
이제는 등록으로 부터 n일째 이후 지속률을 알아보겠습니다. 여기서는 등록후 1일이후, 4일이후, 7일이후, 10일이후, 15일이후, 20일 이후, 30일 이후의 지속률을 알아봅니다.
-- 지속률 지표 관리하는 마스터 테이블 만들기
-- index_name는 지표이름, interval_date는 등록후 며칠째의 지표인지를 나타냄
with repeat_interval(index_name, interval_date) as(
	values
	('01 day repeat',1)
	,('04 day repeat',4)
	,('07 day repeat',7)
	,('10 day repeat',10)
	,('15 day repeat',15)
	,('20 day repeat',20)
	,('30 day repeat',30)
)
, log_index_date as(
	select c.customerid
		,c.register_date
		,s.date as action_date
		,max(s.date) over() as latest_date
		,r.index_name
		,cast(c.register_date + interval '1 day' * r.interval_date as date) as index_date
	from customer_info as c
		left outer join
		sales_date as s
		on c.customerid= s.customerid
		cross join
		repeat_interval as r
)
, user_flag as(
	select customerid
		,register_date
		,index_name
		,sign(sum(CASE WHEN index_date <= latest_date THEN
				 	case when index_date = action_date then 1 else 0 end
				   END)) as index_day_action
	from log_index_date
	group by customerid,register_date,index_name,index_date
)
select
	register_date
	,index_name
	,round(avg(100.0 * index_day_action::integer),2) as repeat_rate
from user_flag
group by register_date,index_name
order by register_date,index_name;
정착률
이제 날짜별로 정착률을 계산하는 쿼리를 만들어 보겠습니다. 정착률 지표에서는 시작일과 끝나는 날짜가 필요합니다. 지속률과 달리 구간별로 확인하기 때문입니다.
-- 정착률 지표 관리하는 마스터 테이블 만들기
-- index_name는 지표이름, interval_date_start와 interval_date_end은 등록후 기간의 구간을 나타낸다.
with repeat_interval(index_name, interval_date_start, interval_date_end) as(
	values
	('07 day retention',1,7)
	,('14 day retention',8,14)
	,('21 day retention',15,21)
	,('28 day retention',22,28)
	,('35 day retention',29,35)
	,('42 day retention',36,42)
	,('49 day retention',43,49)
)
, log_index_date as(
	select c.customerid
		,c.register_date
		,s.date as action_date
		,max(s.date) over() as latest_date
		,r.index_name
		-- 지표의 대상기간 시작일과 종료일 계산
		,cast(c.register_date + '1 day'::interval * r.interval_date_start as date) as index_date_start
		,cast(c.register_date + '1 day'::interval * r.interval_date_end as date) as index_date_end

	from customer_info as c
		left outer join
		sales_date as s
		on c.customerid= s.customerid
		cross join
		repeat_interval as r
)
, user_flag as(
	select customerid
		,register_date
		,index_name
		-- 지표 대상기간에 액선을 했는지 나타내고(SIGN) 사용자 별로 대상 기간에 한 액션 합계 구한후(SUM)
		-- 대상 기간의 종료일이 로그의 최신날짜 이전인지 확인하고(첫번째 CASE)
		-- 지표의 대상기간이 액션을 했으면 1, 안했으면 0이라고 지정한다.(두번째 CASE)
		,sign(sum(CASE WHEN index_date_end <= latest_date THEN
				 	case when action_date between index_date_start and index_date_end then 1 else 0 end
				   END)) as index_day_action
	from log_index_date
	group by customerid,register_date,index_name,index_date_start,index_date_end
)
select
	register_date
	,index_name
	-- 정착률 계산
	,round(avg(100.0 * index_day_action::integer),2) as index_rate
from user_flag
group by register_date,index_name
order by register_date,index_name;
맨 아래 select문을 다음과 같이 바꾼다면 각 정착률 구간마다 비율을 알 수 있습니다.(지속률도 동일한 방식으로 확인할 수 있습니다.)
select
	index_name
	-- 정착률 계산
	,round(avg(100.0 * index_day_action::integer),2) as index_rate
from user_flag
group by index_name
order by index_name;
해당 포스팅은 다음의 책을 활용하여 작성하였습니다.
- 가사키 나가토, 다미야 나오토, 『데이터 분석을 위한 SQL 레시피』, 한빛미디어, p233~257
'SQL & DB > PostgreSQL' 카테고리의 다른 글
| [PostgreSQL] 중복행 제거 (0) | 2023.02.18 |
|---|---|
| [PostgreSQL] 사용자 로그데이터(Log Data) 시계열분석(2) - 행동(action)과 지속률/정착률과의 관계 분석 (0) | 2021.01.22 |
| [PostgreSQL] 사용자 로그데이터(Log Data) 매출분석(3) - RFM 분석 (0) | 2021.01.15 |
| [PostgreSQL] 사용자 로그데이터(Log Data) 매출분석(2) - DECILE분석 (사용자 그룹화 하기) (0) | 2021.01.15 |
| [PostgreSQL] 사용자 로그데이터(Log Data) 매출분석(1) - 사용자들의 특징 찾기(사용자 그룹화, 카테고리별 집계, 벤다이어그램(CASE)) (0) | 2021.01.12 |